“Top generator brand” depends heavily on the segment you’re talking about. Home standby generators (installed systems) are usually compared by market share and installer/dealer reach. Portable and inverter generators are often compared by unit-volume signals and retail penetration.
top generator brands statistics
Commercial/industrial (C&I) generators are typically compared by enterprise-scale reporting (segment sales) and their presence in mission-critical applications like data centers.
Key statistics at a glance
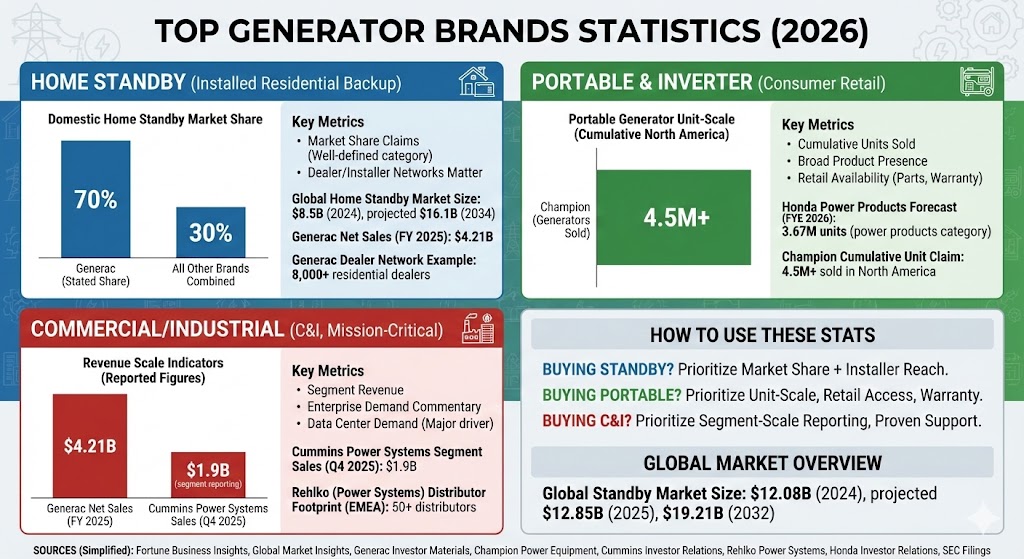
Global standby generator market size: $12.08B (2024), projected $12.85B (2025) and $19.21B (2032).
Global home standby gensets market size: $8.5B (2024), projected $16.1B (2034).
Generac “domestic home standby” market share claim: ~70%.
Generac net sales (FY 2025): $4.21B.
Champion cumulative unit claim: 4.5M+ generators sold in North America.
Cummins Power Systems segment sales (Q4 2025): $1.9B (segment reporting; not company-wide).
50+ distributors across Europe, Africa, and the Middle East (EMEA).
Channel reach indicator, especially useful for non-North America comparisons.
Honda (Power Products)
Power products scale (includes generators within a broader category)
Forecast 3.67M power products unit sales (FYE March 31, 2026).
Context for brand scale; not a generator-only unit count.
Bar chart: Domestic home standby market share (Generac vs all other brands combined)
Generac has stated a ~70% share of the domestic home standby market in investor materials. The remainder (30%) represents all other brands combined.
Label
Bar
Value
Generac
70%
All other brands (combined)
30%
Max = 70%. Widths: Generac 100.00%, All other brands (combined) 42.86%.
Bar chart: Published channel footprint (distribution/service reach examples)
Channel reach can matter as much as product specs in installed and serviced categories. This chart uses two published network-size statements (not directly comparable by region, but useful as “reach” signals).
Max = 8,000. Widths: Generac 100.00%, Rehlko 0.63%.
Bar chart: Revenue scale indicators (reported figures)
Revenue can help you understand the size of a generator-focused business, but comparisons require care because companies report at different scopes (company-wide vs segment; annual vs quarterly).
Label
Bar
Value
Generac net sales (FY 2025)
$4.21B
Cummins Power Systems sales (Q4 2025)
$1.9B
Max = $4.21B. Widths: Generac 100.00%, Cummins Power Systems 45.13%.
Bar chart: Portable generator unit-scale (published cumulative milestone)
In portable categories, cumulative unit statements can be one of the clearest public “scale” indicators.
Label
Bar
Value
Champion generators sold (North America)
4.5M+
Max = 4.5M. Widths: Champion 100.00%.
How to use these stats when comparing brands
If you’re buying standby: prioritize market share in standby + installer/service reach (because installation quality and support affect the total experience).
If you’re buying portable/inverter: prioritize unit-scale signals (installed base), parts availability, and warranty support at common retailers.
If you’re buying C&I: prioritize segment-scale reporting and proven support capability (especially if you need uptime and service contracts).
Sources
Fortune Business Insights — Standby generator market size and forecast: https://www.fortunebusinessinsights.com/standby-generator-market-113533
Global Market Insights — Home standby gensets market size and forecast: https://www.gminsights.com/industry-analysis/home-standby-gensets-market