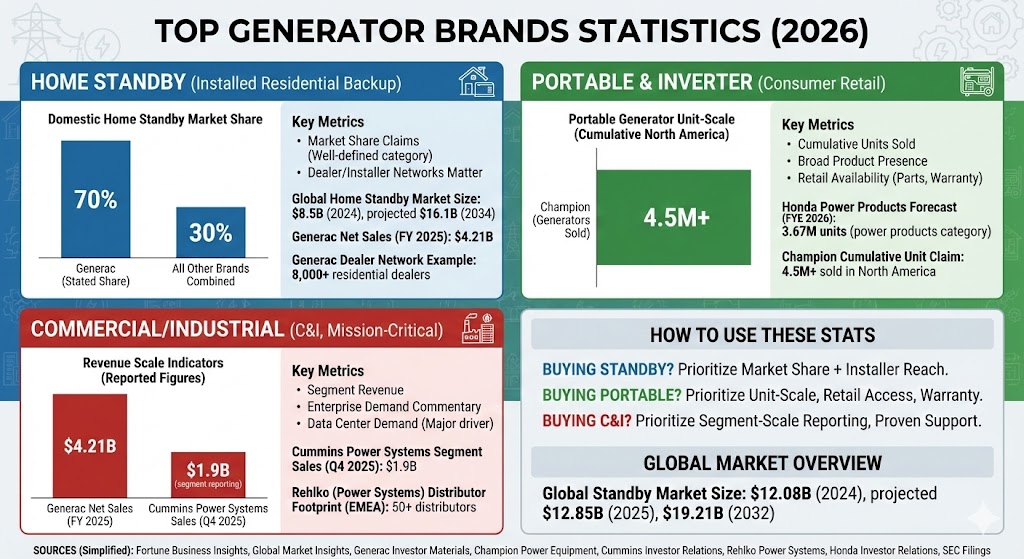
“Top generator brand” depends heavily on the segment you’re talking about. Home standby generators (installed systems) are usually compared by market share and installer/dealer reach. Portable and inverter generators are often compared by unit-volume signals and retail penetration.
top generator brands statistics
Commercial/industrial (C&I) generators are typically compared by enterprise-scale reporting (segment sales) and their presence in mission-critical applications like data centers.
Key statistics at a glance
Global standby generator market size: $12.08B (2024), projected $12.85B (2025) and $19.21B (2032).
Global home standby gensets market size: $8.5B (2024), projected $16.1B (2034).
Generac “domestic home standby” market share claim: ~70%.
Generac net sales (FY 2025): $4.21B.
Champion cumulative unit claim: 4.5M+ generators sold in North America.
Cummins Power Systems segment sales (Q4 2025): $1.9B (segment reporting; not company-wide).
50+ distributors across Europe, Africa, and the Middle East (EMEA).
Channel reach indicator, especially useful for non-North America comparisons.
Honda (Power Products)
Power products scale (includes generators within a broader category)
Forecast 3.67M power products unit sales (FYE March 31, 2026).
Context for brand scale; not a generator-only unit count.
Bar chart: Domestic home standby market share (Generac vs all other brands combined)
Generac has stated a ~70% share of the domestic home standby market in investor materials. The remainder (30%) represents all other brands combined.
Label
Bar
Value
Generac
70%
All other brands (combined)
30%
Max = 70%. Widths: Generac 100.00%, All other brands (combined) 42.86%.
Bar chart: Published channel footprint (distribution/service reach examples)
Channel reach can matter as much as product specs in installed and serviced categories. This chart uses two published network-size statements (not directly comparable by region, but useful as “reach” signals).
Max = 8,000. Widths: Generac 100.00%, Rehlko 0.63%.
Bar chart: Revenue scale indicators (reported figures)
Revenue can help you understand the size of a generator-focused business, but comparisons require care because companies report at different scopes (company-wide vs segment; annual vs quarterly).
Label
Bar
Value
Generac net sales (FY 2025)
$4.21B
Cummins Power Systems sales (Q4 2025)
$1.9B
Max = $4.21B. Widths: Generac 100.00%, Cummins Power Systems 45.13%.
Bar chart: Portable generator unit-scale (published cumulative milestone)
In portable categories, cumulative unit statements can be one of the clearest public “scale” indicators.
Label
Bar
Value
Champion generators sold (North America)
4.5M+
Max = 4.5M. Widths: Champion 100.00%.
How to use these stats when comparing brands
If you’re buying standby: prioritize market share in standby + installer/service reach (because installation quality and support affect the total experience).
If you’re buying portable/inverter: prioritize unit-scale signals (installed base), parts availability, and warranty support at common retailers.
If you’re buying C&I: prioritize segment-scale reporting and proven support capability (especially if you need uptime and service contracts).
Sources
Fortune Business Insights — Standby generator market size and forecast: https://www.fortunebusinessinsights.com/standby-generator-market-113533
Global Market Insights — Home standby gensets market size and forecast: https://www.gminsights.com/industry-analysis/home-standby-gensets-market
Compare 10 of the best power inverters for SUVs in 2026, including compact chargers, USB-C options, and higher-output models for road trips and emergencies.
Compare 10 waterproof DC circuit breakers for boats, RVs, vehicles, solar systems, and audio installations, with practical buying advice for choosing the right amperage.
Compare 10 of the best vitamin C shower filters for reducing chlorine exposure, refreshing shower water, and choosing the right replacement-cartridge setup.